
Well, it’s been a long time. This post will be dedicated to explanations on how to draw graphs in Qt’s QGraphicsScene, using Graphviz. We’re not talking about rendering an SVG graph with Graphviz and then printing it in a scene, however. What we will do, instead, is:
- represent a graph, using a C++ wrapper class for libgraph
- tell Graphviz to compute positions for each node, and the path of each edge
- draw our graph using QGraphicsEllipseItem and QGraphicsPathItem
The whole thing is used in a computer security research project on which I’m not allowed to give any information, so I will be vague on some parts of this tutorial, and I will not provide a whole bunch of ready-to-run code. I’m still going to give you the hints for fulfilling the three tasks above, and I will publish the class I wrote for my project (it is, of course, not generic at all, since it was designed for my particular needs).
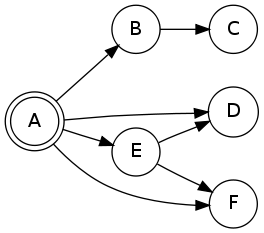
This tutorial assumes you have a decent knowledge of how Graphviz works, and basic knowledge of the QGraphics API. Here is a preview of a possible result with this tutorial, with no tweaking:
Using libgraph to represent a Graphviz graph
A little note on the libgraph API
Before we begin, I would like to point out that the libgraph API is not always well designed. One thing that annoyed me is that all calls to the library require char * parameters when only const char * are needed, which results in compilation warnings. Since I don’t like warnings, I wrote wrappers for the functions that I needed, so I wouldn’t have to use qPrintable(), and I could hide the warnings with const_cast. For instance (the methods will be described in the next sections):
/// The agopen method for opening a graph
static inline Agraph_t* _agopen(QString name, int kind)
{
    return agopen(const_cast<char *>(qPrintable(name)), kind);
}

/// Add an alternative value parameter to the method for getting an object's attribute
static inline QString _agget(void *object, QString attr, QString alt=QString())
{
    QString str=agget(object, const_cast<char *>(qPrintable(attr)));

    if(str==QString())
        return alt;
    else
        return str;
}

/// Directly use agsafeset which always works, contrarily to agset
static inline int _agset(void *object, QString attr, QString value)
{
    return agsafeset(object, const_cast<char *>(qPrintable(attr)),
                     const_cast<char *>(qPrintable(value)),
                     const_cast<char *>(qPrintable(value)));
}
Other functions defined this way: _agnodeattr(), _agedgeattr(), _agnode() and _gvLayout().
Basic wrapper class
The first step is to represent a graph so that Graphviz can compute it. Actually, Graphviz provides libraries for that, so you don’t need to write a dot-syntax file and then use the very ugly (and completely unacceptable inside an application, in my opinion) system() call. A good introduction to this library is available as a PDF guide on Graphviz’s website. I recommend reading it before going any further, because I may forget to explain things about libgraph!
Unfortunately, there is no official C++ port of libgraph, and we’re doing C++ here, so we may want an object that will represent a Graph, with methods for adding Nodes and Edges. Here is a beginning of definition for such a class, which also contains bits of code for managing the aspect of our graph:
/// An object containing a libgraph graph and its associated nodes and edges
class GVGraph
{
public:
    /// Default DPI value used by dot (which uses points instead of pixels for coordinates)
    static const qreal DotDefaultDPI;

    /*!
     * \brief Construct a Graphviz graph object
     * \param name The name of the graph, must be unique in the application
     * \param font The font to use for the graph
     * \param node_size The size in pixels of each node
     */
    GVGraph(QString name, QFont font=QFont(), qreal node_size=50);
    ~GVGraph();

    /// Add and remove nodes
    void addNode(const QString& name);
    void addNodes(const QStringList& names);
    void removeNode(const QString& name);
    void clearNodes();

    /// Add and remove edges
    void addEdge(const QString& source, const QString& target);
    void removeEdge(const QString& source, const QString& target);

    /// Set the font to use in all the labels
    void setFont(QFont font);

private:
    GVC_t *_context;
    Agraph_t *_graph;
    QFont _font;
    QMap<QString, Agnode_t*> _nodes;
    QMap<QPair<QString, QString>, Agedge_t*> _edges;
};
And the associated methods, beginning with the static parameters and the constructor/destructor. All the attributes in the constructor are defined in Graphviz’s documentation.
/*! Dot uses a 72 DPI value for converting it's position coordinates from points to pixels
    while we display at 96 DPI on most operating systems. */
const qreal GVGraph::DotDefaultDPI=72.0;

GVGraph::GVGraph(QString name, QFont font, qreal node_size) :
        _context(gvContext()),
        _graph(_agopen(name, AGDIGRAPHSTRICT)) // Strict directed graph, see libgraph doc
{
    //Set graph attributes
    _agset(_graph, "overlap", "prism");
    _agset(_graph, "splines", "true");
    _agset(_graph, "pad", "0,2");
    _agset(_graph, "dpi", "96,0");
    _agset(_graph, "nodesep", "0,4");

    //Set default attributes for the future nodes
    _agnodeattr(_graph, "fixedsize", "true");
    _agnodeattr(_graph, "label", "");
    _agnodeattr(_graph, "regular", "true");

    //Divide the wanted width by the DPI to get the value in points
    QString nodePtsWidth("%1").arg(node_size/_agget(_graph, "dpi", "96,0").toDouble());
    //GV uses , instead of . for the separator in floats
    _agnodeattr(_graph, "width", nodePtsWidth.replace('.', ","));

    setFont(font);
}

GVGraph::~GVGraph()
{
    gvFreeLayout(_context, _graph);
    agclose(_graph);
    gvFreeContext(_context);
}
We will now see how to add and remove nodes. The node removal function takes care of removing edges as well, so you may want to come back to it after we introduced edges (eventhough the code is pretty straightforward).
void GVGraph::addNode(const QString& name)
{
    if(_nodes.contains(name))
        removeNode(name);

    _nodes.insert(name, _agnode(_graph, name));
}

void GVGraph::addNodes(const QStringList& names)
{
    for(int i=0; i<names.size(); ++i)
        addNode(names.at(i));
}

void GVGraph::removeNode(const QString& name)
{
    if(_nodes.contains(name))
    {
        agdelete(_graph, _nodes[name]);
        _nodes.remove(name);

        QList<QPair<QString, QString> >keys=_edges.keys();
        for(int i=0; i<keys.size(); ++i)
            if(keys.at(i).first==name || keys.at(i).second==name)
                removeEdge(keys.at(i));
    }
}

void GVGraph::clearNodes()
{
    QList<QString> keys=_nodes.keys();

    for(int i=0; i<keys.size(); ++i)
        removeNode(keys.at(i));
}
The special function setRootNode() allows telling the dot layout algorithm which node we want to use as a root for generating the graph (as dot usually displays tree-like graphs, it can start drawing them from a particular node).
void GVGraph::setRootNode(const QString& name)
{
    if(_nodes.contains(name))
        _agset(_graph, "root", name);
}
And now the functions for drawing edges, which are pretty straightforward too:
void GVGraph::addEdge(const QString &source, const QString &target)
{
    if(_nodes.contains(source) && _nodes.contains(target))
    {
        QPair<QString, QString> key(source, target);
        if(!_edges.contains(key))
            _edges.insert(key, agedge(_graph, _nodes[source], _nodes[target]));
    }
}

void GVGraph::removeEdge(const QString &source, const QString &target)
{
    removeEdge(QPair<QString, QString>(source, target));
}

void GVGraph::removeEdge(const QPair<QString, QString>& key)
{
    if(_edges.contains(key))
    {
        agdelete(_graph, _edges[key].first);
        _edges.remove(key);
    }
}
The setFont() method allows you to tell Graphviz which font you want to use for the rendering. You can pass the constructor your application’s current font and write an event handler for when the font changes in your application, that will call this function. Note that I’m not sure it updates the font for existing nodes and edges (in which case you would have to call _agset() on all of them).
void GVGraph::setFont(QFont font)
{
    _font=font;

    _agset(_graph, "fontname", font.family());
    _agset(_graph, "fontsize", QString("%1").arg(font.pointSizeF()));

    _agnodeattr(_graph, "fontname", font.family());
    _agnodeattr(_graph, "fontsize", QString("%1").arg(font.pointSizeF()));

    _agedgeattr(_graph, "fontname", font.family());
    _agedgeattr(_graph, "fontsize", QString("%1").arg(font.pointSizeF()));
}
Compute node positions and edge paths
Surprisingly, this is the very easy part of the job. Graphviz already has several implementations of common graph drawing algorithms, used for different kinds of graphs. In Graphviz, they are called layout, and the most known one is dot. It also is the one I’m using, but you may write additional methods in your class for calling different kinds of layouts – just be aware that some layouts require extra attributes, so you may also want to modify other parts of the class depending on what you need.
void GVGraph::applyLayout()
{
    gvFreeLayout(_context, _graph);
    _gvLayout(_context, _graph, "dot");
}
At this point, you can even render your graph to a file, or to the standard output, using gvRender() and gvRenderFilename() (see the doc). You can also render your graph a first time, and then apply another layout on your rendered graph (some layouts can use position hints already provided in the graph, see the PDF guide.
Once the layout has been called, many more attributes are set in the graph, nodes and edges’s data field. Trying to access this information in the objects before would have lead to unitialised values and null pointers, so there are things that we can do only after having applied a layout. Among these things, we can now retrieve the exact size of the graph in points, and give this information to our QGraphicsView’s setSceneRect() method, which defines the area of the QGraphicsScene that the user can see.
QRectF GVGraph::boundingRect() const
{
    qreal dpi=_agget(_graph, "dpi", "96,0").toDouble();
    return QRectF(_graph->u.bb.LL.x*(dpi/DotDefaultDPI), _graph->u.bb.LL.y*(dpi/DotDefaultDPI),
                  _graph->u.bb.UR.x*(dpi/DotDefaultDPI), _graph->u.bb.UR.y*(dpi/DotDefaultDPI));
}
Two notes about this function: it returns a lovely QRectF object, that we can manipulate much more easily than raw coordinates in Qt ; More important, it converts points into pixels, and it does so by applying a ratio equal to your actual DPI (96) divided by Graphviz’s DPI (72). Of course, you may want to replace 96 by a class parameter or a constant. Just don’t forget that libgraph excepts a coma and not a period as a separator for the integer and the floating part of reals.
Transform the layout attributes into easy-to-use objects
The next step consists of exploiting these attributes in order to draw our graph. As we don’t want to manipulate structs and pointers, however, we will go through a translation step, and transform this raw data into sweet objects, so that all the complex code remains inside our class. Below are the said objects. As you can see, I did not bother with setters and getters, but these objects have a short lifespan, and they’re only passed by copy to users of the GVGraph, so it didn’t really matter to me what was done with them afterwards.
/// A struct containing the information for a GVGraph's node
struct GVNode
{
    /// The unique identifier of the node in the graph
    QString name;

    /// The position of the center point of the node from the top-left corner
    QPoint centerPos;

    /// The size of the node in pixels
    double height, width;
};

/// A struct containing the information for a GVGraph's edge
struct GVEdge
{
    /// The source and target nodes of the edge
    QString source;
    QString target;

    /// Path of the edge's line
    QPainterPath path;
};
Two additional methods must now be added in order to provide these items to users. The simplest one is the node retrieval method, and most of it is straightforward. Just note that Graphviz calculates coordinates starting by the bottom-left corner, while QGraphics uses the top-left corner, so all y-coordinates must be translated.
QList<GVNode> GVGraph::nodes() const
{
    QList<GVNode> list;
    qreal dpi=_agget(_graph, "dpi", "96,0").toDouble();

    for(QMap<QString, Agnode_t*>::const_iterator it=_nodes.begin(); it!=_nodes.end();++it)
    {
        Agnode_t *node=it.value();
        GVNode object;

        //Set the name of the node
        object.name=node->name;

        //Fetch the X coordinate, apply the DPI conversion rate (actual DPI / 72, used by dot)
        qreal x=node->u.coord.x*(dpi/DotDefaultDPI);

        //Translate the Y coordinate from bottom-left to top-left corner
        qreal y=(_graph->u.bb.UR.y - node->u.coord.y)*(dpi/DotDefaultDPI);
        object.centerPos=QPoint(x, y);

        //Transform the width and height from inches to pixels
        object.height=node->u.height*dpi;
        object.width=node->u.width*dpi;

        list << object;
    }

    return list;
}
The serious trouble begins just now: we need to transform a plethora of coordinates into a QPainterPath that can then be used in order to draw a line. Those of you who already messed with Qt’s Bezier curves API know how it works: cubicTo() takes two arguments for the points that the curve must pass by, and one for the ending point, so you have to do multiple calls to it for drawing an entire spline. Very fortunately, it seems that the number of coordinates given by Graphviz always is 3n+1, which makes it possible to easily loop over the list of coordinates. The loop method I’m using is based on the one used for transforming Qt3 spline canvas objects into Qt4 Path objects.
QList<GVEdge> GVGraph::edges() const
{
    QList<GVEdge> list;
    qreal dpi=_agget(_graph, "dpi", "96,0").toDouble();

    for(QMap<QPair<QString, QString>, QPair<Agedge_t*, int> >::const_iterator it=_edges.begin();
        it!=_edges.end();++it)
    {
        Agedge_t *edge=it.value().first;
        GVEdge object;

        //Fill the source and target node names
        object.source=edge->tail->name;
        object.target=edge->head->name;

        //Calculate the path from the spline (only one spline, as the graph is strict. If it
        //wasn't, we would have to iterate over the first list too)
        //Calculate the path from the spline (only one as the graph is strict)
        if((edge->u.spl->list!=0) && (edge->u.spl->list->size%3 == 1))
        {
            //If there is a starting point, draw a line from it to the first curve point
            if(edge->u.spl->list->sflag)
            {
                object.path.moveTo(edge->u.spl->list->sp.x*(dpi/DotDefaultDPI),
                             (_graph->u.bb.UR.y - edge->u.spl->list->sp.y)*(dpi/DotDefaultDPI));
                object.path.lineTo(edge->u.spl->list->list[0].x*(dpi/DotDefaultDPI),
                        (_graph->u.bb.UR.y - edge->u.spl->list->list[0].y)*(dpi/DotDefaultDPI));
            }
            else
                object.path.moveTo(edge->u.spl->list->list[0].x*(dpi/DotDefaultDPI),
                        (_graph->u.bb.UR.y - edge->u.spl->list->list[0].y)*(dpi/DotDefaultDPI));

            //Loop over the curve points
            for(int i=1; i<edge->u.spl->list->size; i+=3)
                object.path.cubicTo(edge->u.spl->list->list[i].x*(dpi/DotDefaultDPI),
                      (_graph->u.bb.UR.y - edge->u.spl->list->list[i].y)*(dpi/DotDefaultDPI),
                      edge->u.spl->list->list[i+1].x*(dpi/DotDefaultDPI),
                      (_graph->u.bb.UR.y - edge->u.spl->list->list[i+1].y)*(dpi/DotDefaultDPI),
                      edge->u.spl->list->list[i+2].x*(dpi/DotDefaultDPI),
                      (_graph->u.bb.UR.y - edge->u.spl->list->list[i+2].y)*(dpi/DotDefaultDPI));

            //If there is an ending point, draw a line to it
            if(edge->u.spl->list->eflag)
                object.path.lineTo(edge->u.spl->list->ep.x*(dpi/DotDefaultDPI),
                             (_graph->u.bb.UR.y - edge->u.spl->list->ep.y)*(dpi/DotDefaultDPI));
        }

        list << object;
    }

    return list;
}
Voilà, we now have proper C++ items with all the relevant information in the way Qt expects it to be. All that’s left is drawing the actual QtGraphicsItems.
Draw the graph with Qt
I am not going to provide code for this last part of the tutorial, as it would involve publishing code that belongs to the project I work on.
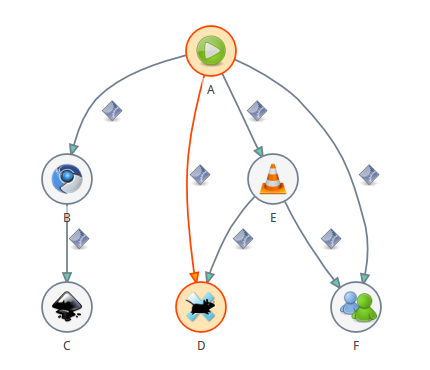
All you have to know is that nodes are to be represented by QGraphicsEllipseItem objects (unless you specified another shape for Graphviz nodes, using the shape node attribute), and that these nodes must be positioned using the centerPos attribute of GVNode. This can be easily achieved by writing a setCenterPos() method that will translate the center coordinates into top-left coordinates and then call the setPos() method itself.
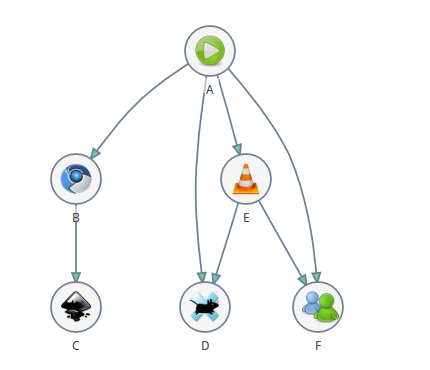
As for edges, they typically are QGraphicsPathItem, and you only have to pass them the GVEdge’s path when constructing them, or via the setPath() method. Easy as pie! And here we go for the comparison between Graphviz rendering and my own Qt-rendered objects (with support for all the QGraphicsItem events):